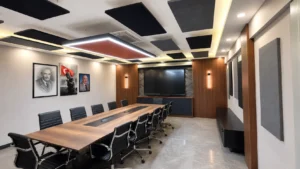
“Reading an Acoustic Report: RT60, STC, NRC and STI Explained”
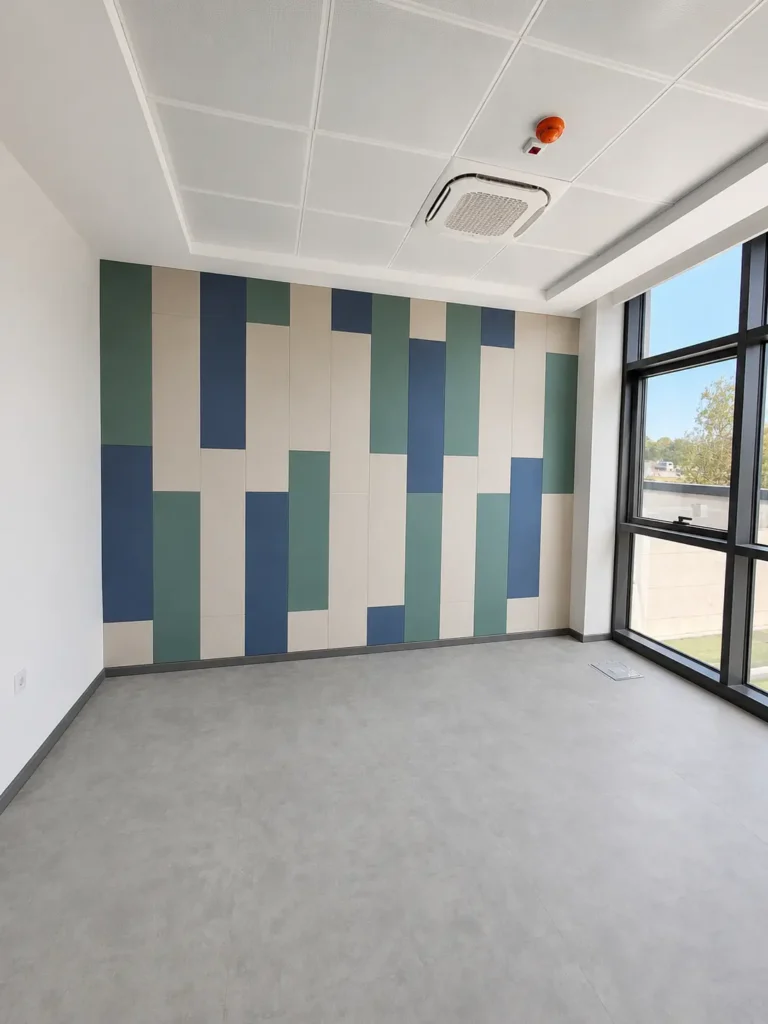
Reading an Acoustic Report: RT60, STC, NRC and STI Explained
An acoustic report is only useful if you can read it. Most reports lean on four families of metric — RT60 (reverberation), NRC/α (absorption), STC/Rw and IIC (insulation), and STI (speech intelligibility) — each measuring a different thing, on a different scale, with a different definition of “good.” This guide defines each one in plain terms, gives you the target ranges we design to, and walks through a worked example so you can open a real report and know, section by section, whether your building is actually a problem or not.
If you have ever been handed a PDF full of octave-band tables, dB figures, and acronyms and quietly nodded along without really knowing what any of it meant, you are in good company — most facility managers, architects, and business owners who commission an acoustic report are not acousticians, and reports are rarely written for a lay audience. That gap causes two predictable problems: either the report gets filed away unread and nothing gets fixed, or a decision-maker misreads a number (mistaking an absorption metric for an insulation one is the single most common error we see) and specifies the wrong remediation entirely. This article exists to close that gap. By the end, you’ll be able to open any competent acoustic report, find the four or five numbers that actually matter, and know what question to ask your consultant next.
The Four Metrics Every Report Leans On
Before getting into definitions, it helps to see the whole landscape at once, because the single most common confusion in reading a report is mixing up metrics that sound similar but measure completely different physical phenomena.
| Metric | What it measures | Governs | Scale / units | Better = |
|---|---|---|---|---|
| RT60 | How long sound decays inside a room | Internal reverberation, “muddiness” | seconds | Lower, within a target range — see below |
| NRC / α | How much a material absorbs incident sound | Reverberation control (a design input, not a room result) | 0–1 (α is per-frequency; NRC is a single-number average) | Higher |
| STC / Rw, IIC | How well a partition blocks sound from reaching the next room | Sound insulation between spaces | dB (unitless index) | Higher |
| STI | How intelligible speech is at a given listening position | Speech clarity or, in open-plan, speech privacy | 0–1 | Depends on goal — higher for a meeting room, lower with distance for open-plan privacy |
Notice the pattern: RT60 and STI describe how a room behaves, NRC/α describes a material property you specify to influence RT60, and STC/Rw/IIC describe a partition’s ability to stop sound crossing from one room into another. Confusing “absorbs sound” with “blocks sound” is the error that leads people to install acoustic foam expecting it to stop noise from the neighboring office — it won’t, because foam is an absorption product, not an insulation product. We cover that specific confusion at length in sound absorption vs. soundproofing, and the closely related question of exactly which lab rating (STC, Rw, or NIC) you should be quoting in STC vs. Rw vs. NIC — both worth a detour if a report is quoting a rating you don’t recognize.
RT60: How Long the Room Rings
Reverberation time (RT60) is the time, in seconds, for sound in a room to decay by 60 dB after the source stops. It is an entirely internal property of one room — it says nothing about what’s happening next door. We’ve written a full explainer on the underlying physics and the Sabine formula (RT60 = 0.161 × V / A) in what is reverberation time (RT60), so here we’ll focus only on how to read it in a report.
A report should give you RT60 per octave band (125 Hz to 4 kHz, sometimes 2 kHz upward too), not a single average figure — more on why that matters below. Compare the measured value against the target for the room’s actual use:
| Room type | Target RT60 |
|---|---|
| Private office / open-plan office | 0.4–0.7 s |
| Meeting room / boardroom | 0.5–0.8 s |
| Classroom | ≤ 0.6 s (ANSI/ASA S12.60) |
| Restaurant / café (small) | ~0.6 s |
| Restaurant / café (larger) | 0.6–1.0 s |
| Recording / tracking room | 0.4–0.6 s |
| Mixing / control room | 0.3–0.4 s |
| Auditorium / lecture hall (speech) | 0.8–1.2 s |
| Concert hall / music performance | 1.2–2.0 s |
If a meeting room measures RT60 of 1.1 seconds against a 0.5–0.8 s target, that’s a clear, quantified gap — and it’s usually the single biggest driver of “muddy,” fatiguing meetings and poor video-call pickup, a topic we go into in conference room acoustics: fixing muddy meetings. Note also that RT60 has no universal “lower is always better” rule — a concert hall targeting 1.5 seconds isn’t a defective room; it’s doing its job. Read the target column against the room’s actual use, not against some generic ideal.

NRC and α: How Absorptive a Material Is (Not the Room)
NRC (Noise Reduction Coefficient) is a single number from 0 to 1 printed on almost every acoustic product data sheet — it’s the arithmetic average of the sound absorption coefficient (α) at 250, 500, 1000, and 2000 Hz, tested per ASTM C423 and rounded to the nearest 0.05. An NRC of 0.85 means the material absorbs roughly 85% of the mid-frequency sound energy that hits it; 0.00 is fully reflective, 1.00 (or occasionally slightly above, due to test-method edge effects) is fully absorptive.
Two things about NRC trip people up in a report, and both matter:
- NRC describes a material, not a room result. A report might say “specified ceiling panel: NRC 0.90.” That’s an input to the RT60 calculation (via the Sabine formula), not the room’s actual measured or predicted reverberation time. A high-NRC panel installed in insufficient quantity, or on the wrong surface, still leaves a room over its RT60 target.
- NRC hides the frequency curve. Because it’s an average of just four bands, two materials with identical NRC 0.85 can behave completely differently at 125 Hz or 4 kHz — thin foam, for example, absorbs highs well but does almost nothing for bass. A good report — or at minimum, a good product data sheet — shows the full per-frequency α curve, not just the NRC shorthand. We go deep on this distinction, including the finer SAA rating that some manufacturers now quote instead, in NRC vs. the sound absorption coefficient.
If your report recommends a certain quantity of “NRC 0.85 ceiling absorption,” it should also show you the resulting predicted RT60 via the Sabine formula — not leave you to trust the NRC number in isolation.
STC, Rw and IIC: How Well a Wall or Floor Blocks Sound
STC (Sound Transmission Class) is a single-number lab rating (tested per ASTM E90, rated per ASTM E413) describing how well a partition blocks airborne sound — voices, music, traffic noise. Unlike RT60 and NRC, higher is unambiguously better, and the practical meaning of specific values is worth memorizing:
| STC rating | Real-world meaning |
|---|---|
| 25 | Normal speech clearly understood through the wall |
| 40 | Loud speech audible but faint |
| 50 | Loud speech barely or not audible; normal speech inaudible |
| 60 | Very good privacy |
Rw (Weighted Sound Reduction Index) is the ISO/European equivalent (ISO 717-1), close to but not numerically identical to STC — different reference curve and frequency weighting mean a report should quote whichever rating your market and code actually use, and not treat the two as interchangeable to the decimal. IIC (Impact Insulation Class), tested per ASTM E492, rates a floor’s ability to block impact/structure-borne noise — footfall, dropped objects — and is a completely separate rating from STC: a floor assembly can score well on STC (blocking voices) and poorly on IIC (transmitting every footstep from the room above), or vice versa.
Building-code minimums are a useful anchor when reading a report’s “target” column: US code (IBC, Group R occupancies) requires walls and floor/ceiling assemblies between hotel guest rooms to be at least STC 50 and floors at least IIC 50; many hotel brand standards ask for STC 55–60 for a genuinely quiet guest experience. UK Approved Document E sets new-build separating-wall/floor minimums of DnT,w+Ctr ≥ 45 dB airborne and L’nT,w ≤ 62 dB impact (note: for impact ratings, lower is better, since it’s measuring transmitted impact noise level, not a blocking index). If a report is assessing guest-room or apartment separation, we cover the full ratings picture in hotel sound insulation and STC in guest rooms and the general regulatory backdrop in sound insulation building regulations.
The weak-link principle, which every good insulation section of a report should address explicitly: overall performance is capped by the weakest single element in the assembly. A wall rated STC 55 on paper is worthless if it’s undermined by a hollow-core door, an unsealed gap underneath it, a shared ceiling plenum, or back-to-back electrical boxes carrying sound around the wall (flanking transmission). If a report quotes a wall’s lab STC but doesn’t discuss doors, seals, and flanking paths, ask for that section — it’s usually where the actual performance gap lives.
STI: Is the Speech Actually Intelligible?
Speech Transmission Index (STI) is a 0–1 scale, standardized under IEC 60268-16, that quantifies how intelligible speech is at a given listening position, accounting for both reverberation and background noise. Qualitative bands are:
| STI range | Rating |
|---|---|
| < 0.30 | Bad |
| 0.30–0.45 | Poor |
| 0.45–0.60 | Fair |
| 0.60–0.75 | Good |
| > 0.75 | Excellent |
Here’s the twist that trips people up more than any other metric in this article: the same measurement is good news or bad news depending on where it’s taken and why. Inside a meeting room, at the seats where people actually need to understand each other, you want STI high — good to excellent. But in an open-plan office, measured at increasing distance from a speaker’s desk, you want STI to drop quickly with distance, because that’s what gives nearby colleagues speech privacy instead of being distracted by every phone call two desks over. We cover the meeting-room side in speech intelligibility (STI) in meeting rooms.
That open-plan version of STI is formalized under ISO 3382-3 with its own related parameters, which a good open-plan report will quote alongside or instead of raw STI:
- D2,S — spatial decay rate of speech per distance doubling, in dB. Below 5 dB is poor; ≥7 dB is the target for good conditions.
- Lp,A,S,4m — the A-weighted level of speech measured 4 m from the speaker. Above 50 dB is poor; lower is better, good is roughly ≤48 dB.
- rD, distraction distance — the distance at which STI drops below 0.50. Beyond this distance nearby speech stops being distracting. Greater than 10 m is poor; less than 5 m is the good target.
- rP, privacy distance — the distance at which STI drops below 0.20, beyond which speech is essentially unintelligible (true privacy).
- Lp,A,B — average background noise level, which raises the noise floor and helps push STI down faster with distance (this is the mechanism behind engineered sound masking, most effective at 45–48 dBA).
If your report is for an open-plan floor and doesn’t quote D2,S and distraction distance somewhere, it’s missing the metric that actually predicts whether people will complain about overhearing each other — see distraction distance and speech privacy for the full breakdown of why this figure matters more than raw STI in that context.

What Each Number Does NOT Tell You
Every metric in this article is a simplification, and reading past the headline figure is where a report earns its fee (or where a cheap one falls short). Three gaps to check for specifically:
1. Single-number vs. octave-band. RT60, NRC, and STC are all, by design, single figures that compress a full frequency response into one number for easy comparison. That convenience hides real problems: a room can have an acceptable single-number RT60 while still booming at 125 Hz because there’s no low-frequency absorption, or a wall can have a respectable STC rating while still leaking bass through a mass-law dip at a specific frequency. A thorough report shows the octave-band breakdown behind each headline number, not just the average — if yours doesn’t, ask for it.
2. Lab vs. field. STC, IIC, and NRC are typically lab ratings — measured under controlled conditions (ASTM E90/E492/C423) that represent best-case performance. Field-measured equivalents — ASTC, AIIC, or the ISO field ratings DnT,w and L’nT,w — are usually several points worse than the lab number, because of workmanship, flanking paths, and installation details a lab test can’t capture. If a report only cites lab ratings for an existing building’s performance, ask whether the values were actually measured on site or pulled from a manufacturer’s lab data sheet — those are very different claims.
3. Absorption is not insulation, ever. This is worth a third mention because it’s the single costliest misreading we see: a high-NRC ceiling tile or wall panel improves the room’s own RT60 and has essentially no effect on how much sound reaches the room next door. If your actual complaint is noise coming from an adjacent space — not a room that sounds bad on its own — a report (and remediation) built around NRC and RT60 is solving the wrong problem; you need an insulation assessment instead, covered under our sound insulation solutions service line.
How a Good Report Is Structured
Beyond the individual numbers, the structure of a competent acoustic report tells you a lot about its quality. We build every report we deliver — and every survey we run — around this sequence, which we detail in full in how acoustic measurement is performed and what a professional acoustic survey includes:
- Measured value — what the room or partition actually does today, per frequency band, using calibrated equipment (ISO 3382 for RT60, a Class 1 sound level meter for LAeq, field STC/ASTC or DnT,w/L’nT,w for insulation, ISO 3382-3 parameters and STI for open-plan/speech privacy).
- Applicable target or standard — the relevant code minimum or design target for that specific room type (ANSI/ASA S12.60 for a classroom, IBC STC 50 for a hotel wall, 0.5–0.8 s RT60 for a meeting room, etc.), stated explicitly, not implied.
- The gap — the quantified difference between measured and target, ideally per frequency band, so you can see where the shortfall is concentrated (e.g., “meets target at 500 Hz–2 kHz, 4 dB short at 125 Hz”).
- Diagnosed cause — why the gap exists: insufficient ceiling absorption, a hollow-core door undermining an otherwise adequate wall, flanking through a shared plenum, excessive occupant density, and so on. A report that jumps straight from “measured” to “recommendation” without stating a cause is asking you to trust a conclusion you can’t verify.
- Remediation design — specific, quantified treatment (e.g., “add 40 m² sabins of ceiling absorption at NRC 0.85” or “replace door with an acoustic door rated STC 35, minimum”) rather than a vague suggestion to “add some panels.”
- Predicted result — the RT60, STC, or STI value the remediation is expected to achieve, calculated (typically via the Sabine formula for RT60) so you have a number to hold the finished installation against.
A report missing steps 3 through 6 is really just a measurement log, not a diagnostic report — useful as a baseline, but it won’t tell you what to actually do or how to know when you’ve done enough.
Worked Example: Reading a Fictional Office/Meeting-Room Report
To make this concrete, here’s how we’d read a (fictional, but realistic) excerpt from a report covering an open-plan floor and an adjoining glass-walled meeting room.
Open-plan floor, measured:
- RT60 (500 Hz–2 kHz average): 0.9 s — target for open-plan office is 0.4–0.7 s. Gap: 0.2–0.5 s over target.
- D2,S: 4.2 dB — target ≥7 dB for good conditions. Below target.
- rD (distraction distance): 12 m — target <5 m. Well above target, poor.
- Lp,A,B (background level): 38 dBA — below the 42 dBA floor where masking becomes effective.
Reading it: the room is too reverberant for its RT60 target, and — more tellingly for daily complaints — its distraction distance of 12 m means colleagues 12 meters away can still make out what someone is saying, roughly double the “good” 5 m benchmark. The low D2,S (4.2 dB, versus a 7 dB target) confirms speech isn’t decaying fast enough with distance, which is consistent with the long RT60. The low background level (38 dBA) means there’s no masking cushion helping the situation either — it’s likely to feel especially exposed in quiet stretches of the day. Diagnosed cause in a report like this would typically point to insufficient ceiling absorption and a lack of screening between desk clusters; remediation would combine ceiling treatment (to pull RT60 and D2,S back into range), possibly desk screens, and consideration of engineered sound masking at 45–48 dBA. This is exactly the “Absorb, Block, Cover” logic covered in office noise absorption, masking, and screens.
Meeting room, measured:
- RT60: 1.1 s — target 0.5–0.8 s. Over target by 0.3–0.6 s, likely from the glass walls and hard table/floor finish.
- STI (mid-room, seated positions): 0.58 — “fair,” short of the “good” 0.60–0.75 band you’d want for confident, low-fatigue conversation and clean video-conference pickup.
- Insulation to adjacent room: field-tested at ASTC 42 against a glass partition rated STC 38 lab (typical field/lab gap due to door seals and frame gaps). No stated target — flagged as informational only, since the adjoining space is a corridor, not a confidentiality-sensitive room.
Reading it: the meeting room’s excess RT60 (1.1 s vs. 0.8 s ceiling) is almost certainly why STI lands at a merely “fair” 0.58 instead of “good” — the two are linked, since a shorter, better-controlled decay is one of the biggest levers for improving STI, a connection we cover further in what is reverberation time (RT60). The insulation figure here is informational rather than a compliance failure, since it’s flagged against a corridor rather than a room needing confidentiality — a reminder that not every number in a report is a “fix this” item; some are simply documenting current condition for context. A remediation plan would likely add wall or ceiling absorption to bring RT60 toward 0.7–0.8 s, predicting the resulting STI improvement rather than just hoping it improves.
This is the level of interpretation a report should support — measured value, target, gap, cause, fix, and predicted outcome, for every parameter that actually matters for how the space is used, whether that’s an office or a dedicated office acoustics program spanning multiple rooms.

Glossary: Quick Reference Table
| Metric | Measures | Units | Better = |
|---|---|---|---|
| RT60 | Reverberation decay time inside a room | seconds | Lower, within a use-specific target range |
| NRC | Single-number average sound absorption of a material | 0–1 | Higher |
| α (absorption coefficient) | Absorption of a material at one specific frequency | 0–1 (occasionally >1 in lab tests) | Higher |
| SAA | Finer 12-band average absorption (alternative to NRC) | 0–1 | Higher |
| STC | Lab rating of airborne sound blocking through a partition | dB (index) | Higher |
| Rw | ISO/European equivalent of STC | dB (index) | Higher |
| IIC | Impact/footfall noise blocking through a floor | dB (index) | Higher |
| DnT,w / L’nT,w | Field airborne / impact insulation ratings (ISO) | dB | Higher (DnT,w) / Lower (L’nT,w) |
| STI | Speech intelligibility at a listening position | 0–1 | Higher for meeting rooms; lower with distance for open-plan privacy |
| D2,S | Spatial decay rate of speech per distance doubling | dB | Higher |
| LAeq / Lp,A,B | Average background noise level | dBA | Context-dependent (lower for focus/quiet spaces, 45–48 dBA target for masking) |
Request a Measured Acoustic Report for Your Space
If you’ve been handed a report you’re not sure how to act on — or you don’t have one yet and need a genuine, measured baseline before deciding what to fix — the fastest path forward is a proper site survey rather than guesswork. Our team measures RT60, background noise, insulation, and (where relevant) STI and the ISO 3382-3 open-plan parameters directly in your space, states the applicable target for each, and hands you a report structured exactly as described above: measured, target, gap, cause, remediation, and predicted result. Request a site survey or acoustic measurement and we’ll walk you through your report line by line, in plain language, before recommending anything.
FAQ
What is the difference between STC and NRC?
STC rates how well a partition (wall, door, floor/ceiling assembly) blocks airborne sound from reaching an adjacent space — a sound insulation metric, where higher is better. NRC rates how much a material absorbs sound striking it, controlling reverberation inside the room it’s installed in — a sound absorption metric. A material can have high NRC and near-zero STC contribution, and vice versa; they answer completely different questions and are not interchangeable.
What RT60 should a meeting room have according to an acoustic report?
Meeting rooms and boardrooms typically target an RT60 of roughly 0.5 to 0.8 seconds. A report showing RT60 meaningfully above 0.8 seconds usually correlates with the “muddy meeting” complaints and reduced STI (speech intelligibility) we see in under-treated meeting spaces, and is one of the most common findings that drives a conference room acoustics remediation.
Why does my report show STI as good in one location and poor in another within the same building?
Because STI is measured at a specific listening position relative to a specific speech source, and both reverberation and background noise vary by location. Inside a meeting room at the seats where people talk, you want high STI. In an open-plan office, measured at increasing distance from someone’s desk, you actually want STI to fall quickly — that’s what gives colleagues speech privacy instead of overhearing every conversation, and is captured by the distraction-distance parameter (rD) under ISO 3382-3.
Is a higher NRC always better?
Not necessarily, and not in isolation. NRC only tells you a material’s average absorption across four mid-range frequencies (250 Hz–2 kHz); it says nothing about how that material performs at low or high frequencies, and it says nothing about whether enough of it has been installed to hit a room’s RT60 target. A report or spec sheet quoting NRC without the underlying per-frequency α curve, or without translating it into a predicted RT60 via the Sabine formula, is giving you a partial picture.
What’s the difference between a lab rating and a field rating in an acoustic report?
Lab ratings (STC, IIC, NRC) are measured under controlled test-chamber conditions per ASTM standards and represent best-case performance for that exact assembly. Field ratings (ASTC, AIIC, or the ISO equivalents DnT,w and L’nT,w) are measured in the actual, completed building and are typically several points worse than the lab number, due to flanking transmission, seals, and installation quality. If a report is assessing an existing building’s real-world performance, confirm whether the cited values are field-measured or pulled from a manufacturer’s lab data sheet.
My report shows good insulation (STC) but the room still sounds echoey — what’s wrong?
Nothing is wrong with the report — it’s showing you two genuinely independent properties. Good STC/Rw means the room is well isolated from its neighbors; it says nothing about how that room sounds internally. A well-insulated room can still have poor RT60 if its interior surfaces are hard and reflective with insufficient absorption. You need both a healthy STC/Rw figure (isolation) and a healthy RT60/NRC figure (absorption) — treating one does not improve the other.
Designing silence for real spaces.
Offices, hotels, restaurants, schools and healthcare — measured acoustic solutions, delivered end to end.
Related articles

How Is an Acoustic Measurement Actually Performed? A Step-by-Step Guide
Read article →
NRC vs. Sound Absorption Coefficient: How to Read Acoustic Product Data
Read article →